NBA player stats research using Pandas
After having done a data and analytics project on Azure for work for the last year I felt compelled to get more into the topic of data engineering. I had started to collect links to articles and tutorials regarding data engineering a while ago and one of them I always wanted to get back to was this one where two Azure Cloud Advocates had created an 8 part series on AI and ML. It had gotten my attention because they used data about basketball players to teach the basics of data engineering and data science coding.
While they used artifical data as a basis I wanted to look at real data from the NBA though from the last season as I was getting ready for my second season of Yahoo fantasy basketball. I wanted to do some analysis of player’s data before my upcoming fantasy draft in order to take better decisions on which players to pick.
I understand that one of the main tasks of a data engineer is to get the data and bring it into a form which can be consumed by the data scientist. Getting the data in my scenario meant to download it from the NBA’s stats database somehow. I realized that the NBA is most probably not interested in providing its data to (normal) consumers via an API so I ended up just copying and pasting all the statistics for each player of last season (fortunately this was one manual copy&paste action). I then needed the following three commands to get the data into a readable CSV file:
// Replace tabs with commas in the file
sed 's/\t/,/g' nba_export_20012002.raw > nba_export_20012002.step1
// Remove the player ID at the beginning of each line
sed '/^[0-9]\{1,3\},$/d' nba_export_20012002.step1 > nba_export_20012002.step2
// Remove line breaks after lines 1, 3, 5, etc. as the name and the data of a player was spread over 2 lines
paste -d "," - - < nba_export_20012002.step2 > nba_export_20012002.csv
I then ran through most of the data analysis activties they were teaching in the first and second AI and ML series using the NBA data which I had downloaded. This meant using Pandas in a Jupyter notebook in VS Code. Since I did not have too much time before my upcoming NBA draft I focussed on getting the best performing players in each of the categories which are used in fantasy basketball to determine the winner of a game week. E.g. in order to get the players with the highest count of three point field goals made I used the following command:
top3pm = player_df.nlargest(100,'3PM')
top3pm.head(20)
During my actual fantasy draft I then reran my notebook constantly after players were taken in order to decide whom I should be picking. I was very pleased when the draft was over as I was able to pick quite a few leading players from last season. Time will tell however if these players will also be able to perform as good this season.
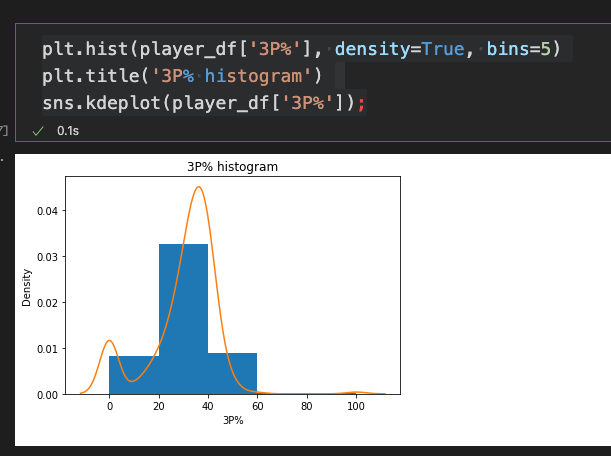
I then went on to create histograms on the various player categories as it was teached during the series. We were instructed to look at graphs which would not show a typical bell-shaped curve regarding the distribution of data and again the category of three point field goals (this time this would be field goals made in percent) was catching my interest. As it can be seen in the next screenshot there is some density of the data around the 0% mark and a lot more density around the 40% mark. This basically means that there were a few players last year which did not make any succesful three pointers at all during the season and quite a few which made around 40% of their three point attempts.
I ran two more commands in order to get the exact amount of players scoring more than 30% of their three point attempts as well as to get the exact amount of players scoring 0% during last season.
player_df.loc[player_df['3P%'] >= 30].info()
player_df.loc[player_df['3P%'] == 0].info()
According to the NBA statistics there were 355 players that scored more than 30% and 61 players that scored exactly 0%.
I remembered that during the NBA games which I watched last season the commentators would emphasize on the fact that the game had changed and that more and more players (and even the ones playing at the center position) would attempt three pointers. I was wondering if I could back this up by running more queries on NBA data so I went back to the statistics page and also got the player data for the 2011-2012 season and the 2001-2002 season. I recreated the histograms and also got the exact numbers and indeed the number of three point field goals made increased in the last 20 years. Back in 2001 there were still 153 players which had scored 0% of their three point field goal attempts (while as written above last season there were only 61 still).
Using Pandas and working with my NBA data set was a lot of fun. Personally I have to say however that during the second part of the AI and ML learning series it went a bit too deep into actual data science, at least for me. It seems I am more interested in getting data and massaging it so that somebody else could create a sophisticated analytics model on top of it.