Hello World - Hello Apache Flink Memory Monitoring
Who would have thought that my first blog entry would be about monitoring ! Monitoring, or more specifically application performance monitoring (APM), is something I normally „only“ deal with in my professional life. However I was suffering from a nasty problem in my data platform so it was time to put those monitoring tools I had installed to the test in order to do some Apache Flink Memory Monitoring !
A few weeks back I realized that my data platform (or „dataspa“ as I call it, since data is being heavily massaged in there) was having an issue. To be more specific: my taskmanager which runs a number of different jobs (processing of events captured from various websites and APIs, ingestion of user actions from the UI, etc.) was shutting down after a few days.
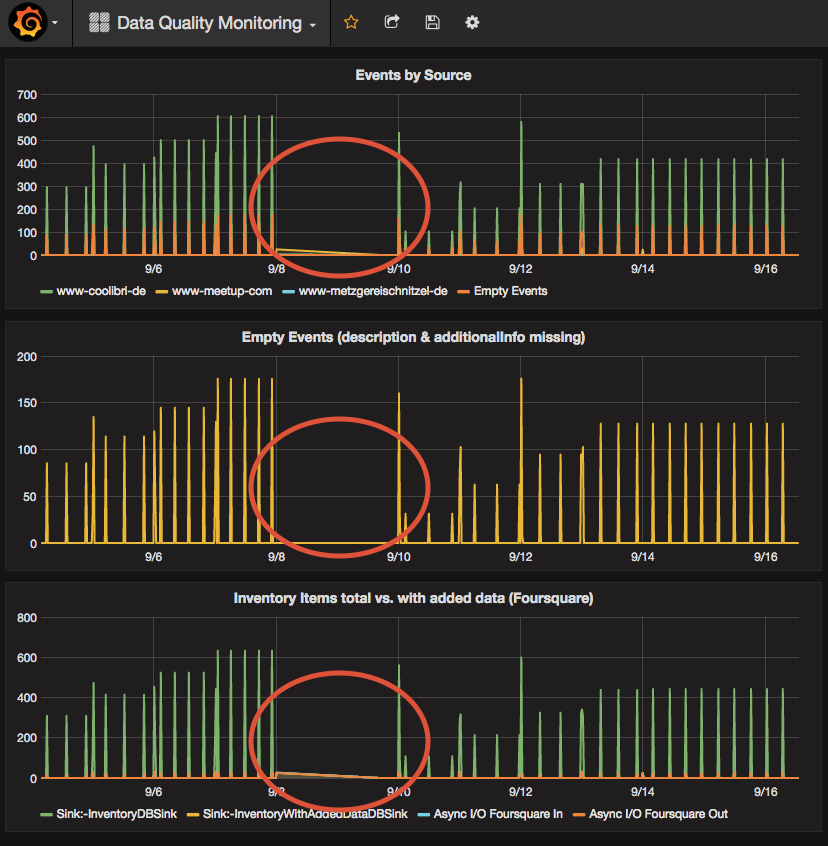
Up to this point I haven’t configured any sort of alarming but I built a dashboard in Grafana focussing on the data flow and quality and it became clear that at times no data was being processed by the platform. Some of the data is dependent on user interaction of course but the event capturing and processing happens at night every night so there should be at least this activity which was sometimes just not there.
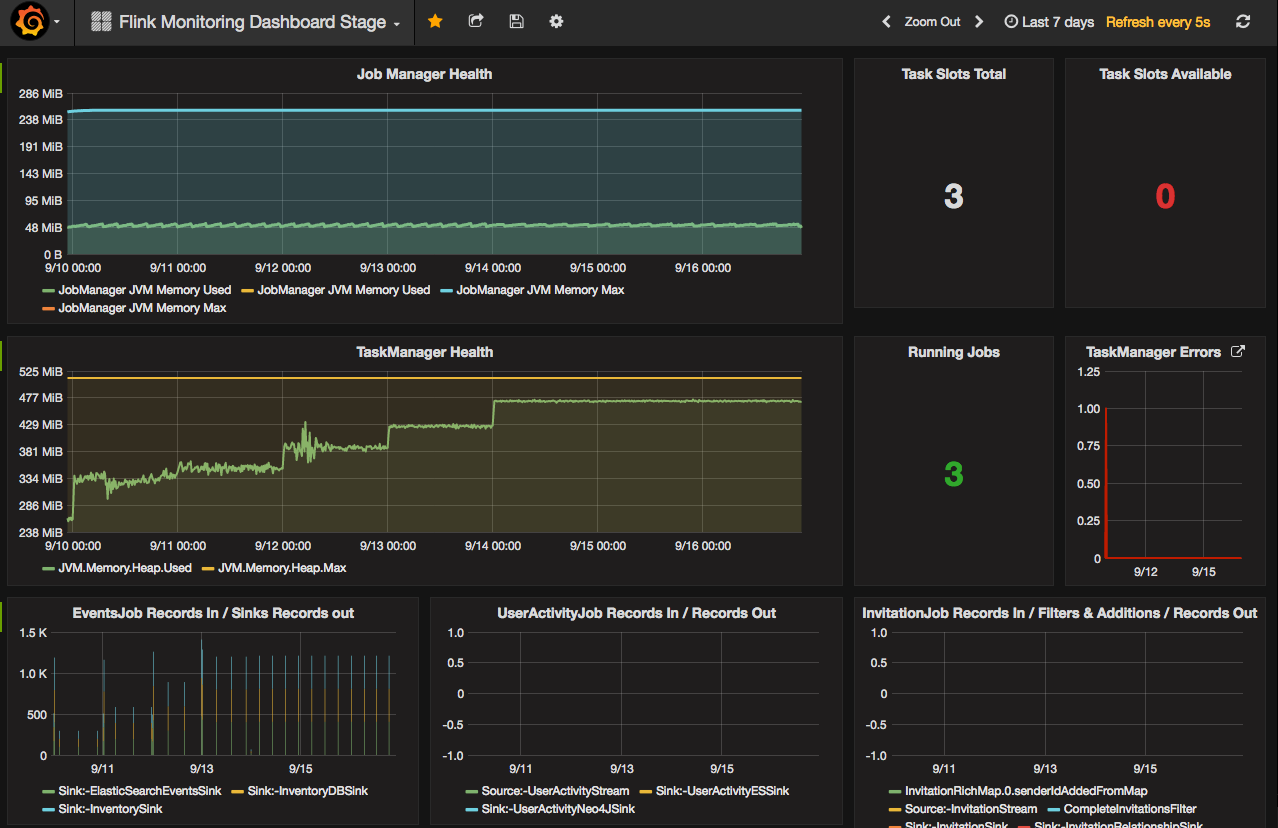
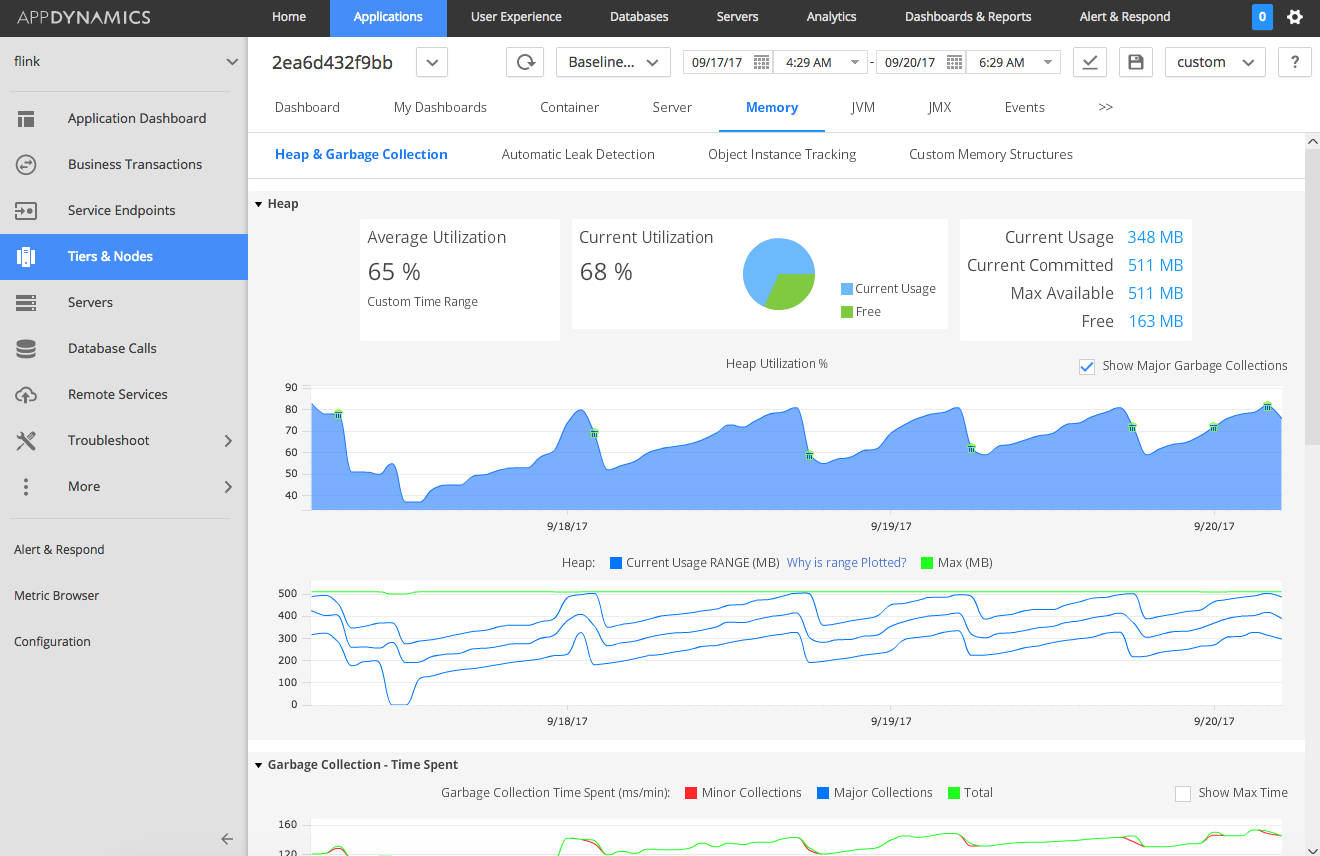
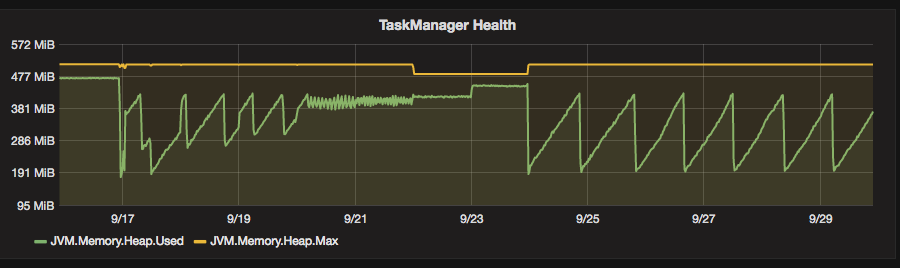
I was looking at possible causes and there are two interesting facts showing on my Flink Monitoring Dashboard (a dashboard focussing more on the infrastructure). First of all the memory in my Taskmanager was building up and never got cleaned up.
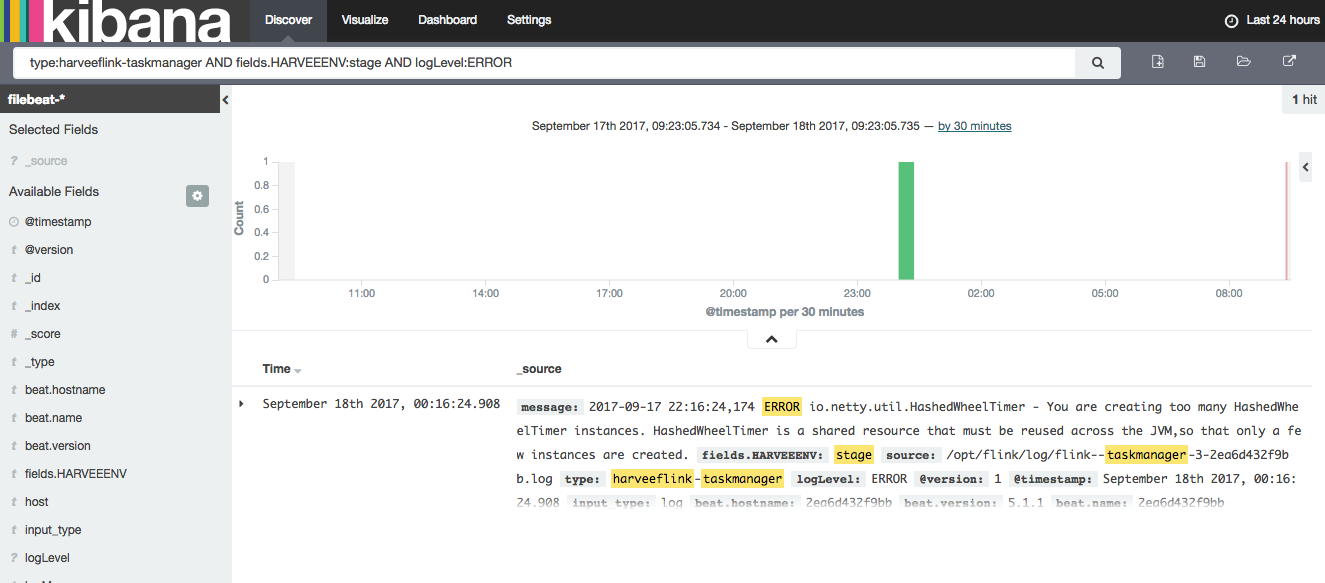
Secondly there were errors in my taskmanager logfiles which were captured with the filebeat/ELK mechanism. The error log messages were talking about too many instances for a certain class which could explain the memory increasing if those were not recycled after a while.
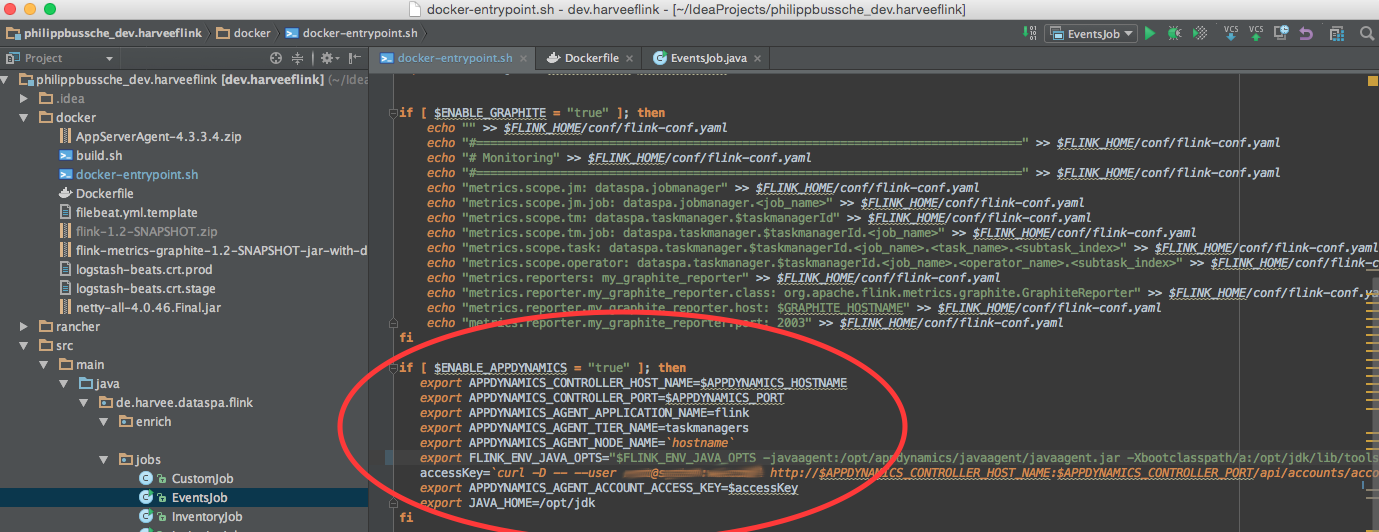
As a next step it felt right to investigate the memory consumption in the taskmanager. As I was stating in the About page of this blog I am working for a company called AppDynamics which has created an APM product that should help me to dig a bit deeper into the memory behaviour of my app. In order to do that I had to deploy the AppDynamics Java agent into my application which for me meant to adjust the container image since my deployment mechanism is all Docker based. I like activating additional features through environment variables so all I had to do was to add a section in the entrypoint script, which would set the necessary parameters to activate the agent (obviously my Dockerfile was taking care of copying and unzipping the agent binaries to where I needed them).
After rebuilding and redeploying the container a new node representing the taskmanager was showing up in my AppDynamics UI. Looking at the heap metrics in here I could also see that memory was constantly building up.
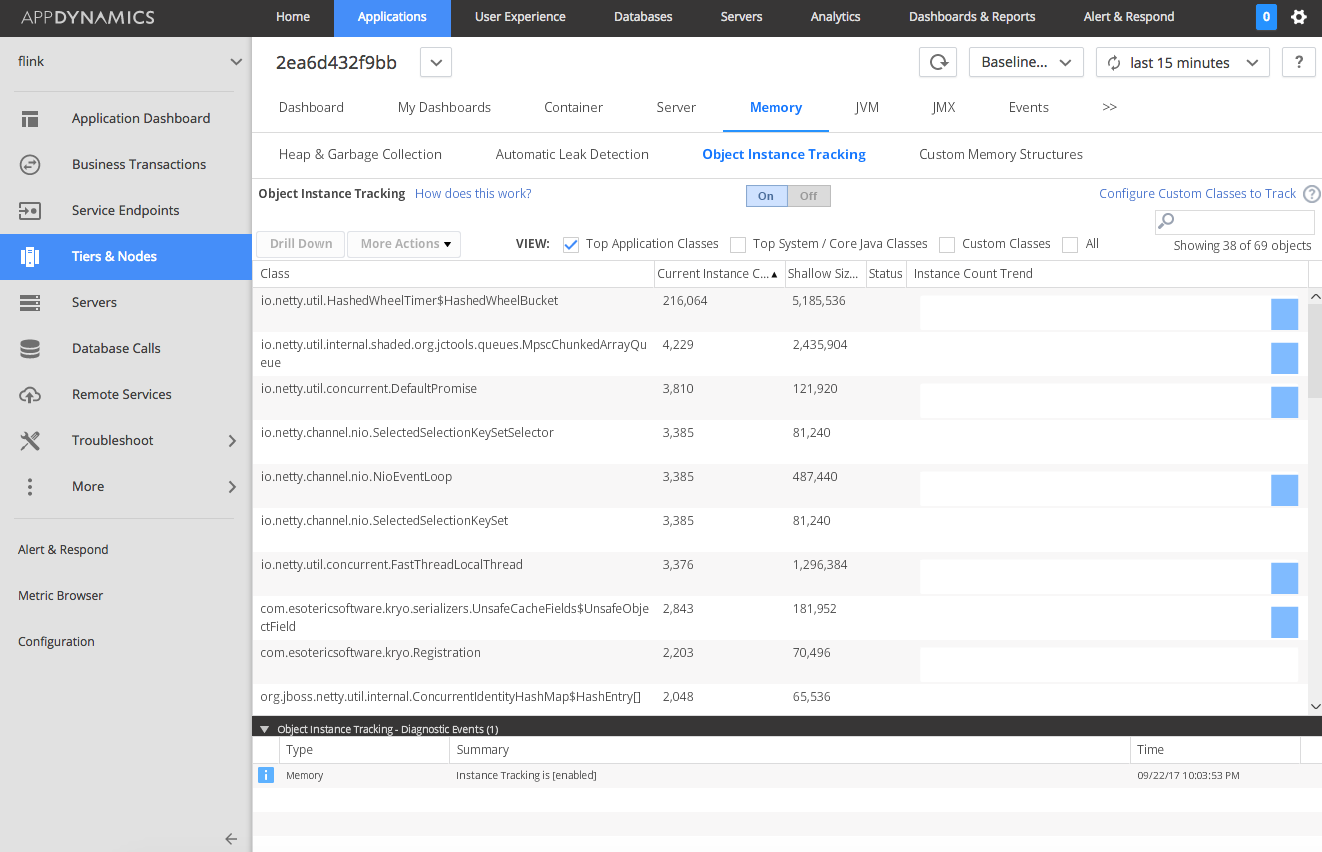
AppDynamics allows you to count object instances in the Java heap which I wanted to do next. I actually enabled and disabled this feature a few times to mark the difference in object counts but also I did not want to leave it active all the time as I know this can add substantial overhead to the JVM. In all of my evaluations there was always the same class showing up at the top which was: io.netty.util.HashedWheelTimer
Having confirmed that I am suffering from a memory leak I now had to find out where it was caused. I knew that the leak was not always there so it must have been introduced when I implemented the latest functionality. In fact by going back in time in my monitoring dashboards I could see the first symptoms of the memory leak occurring right after I implemented a mechanism which I added to enrich data traversing my data platform (as part of the events I am also capturing venue names which I wanted to ran past the Foursquare API in order to get more information on those venues including their geo locations). The mechanism is based on the Async I/O functionality in Apache Flink. With it a http request is executed against the Foursquare API for each element in my data stream (which does not already have geo coordinates assigned with it). Using Flink’s Async I/O feature is done by implementing a class which extends RichAsyncFunction. The most important thing is to implement a method called „asyncInvoke“. Below you can see the initial version of my implementation.
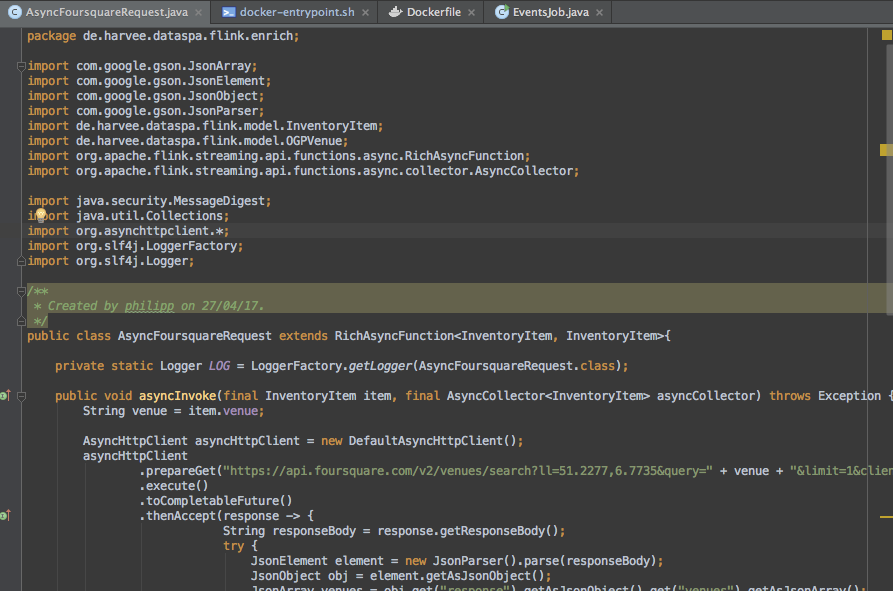
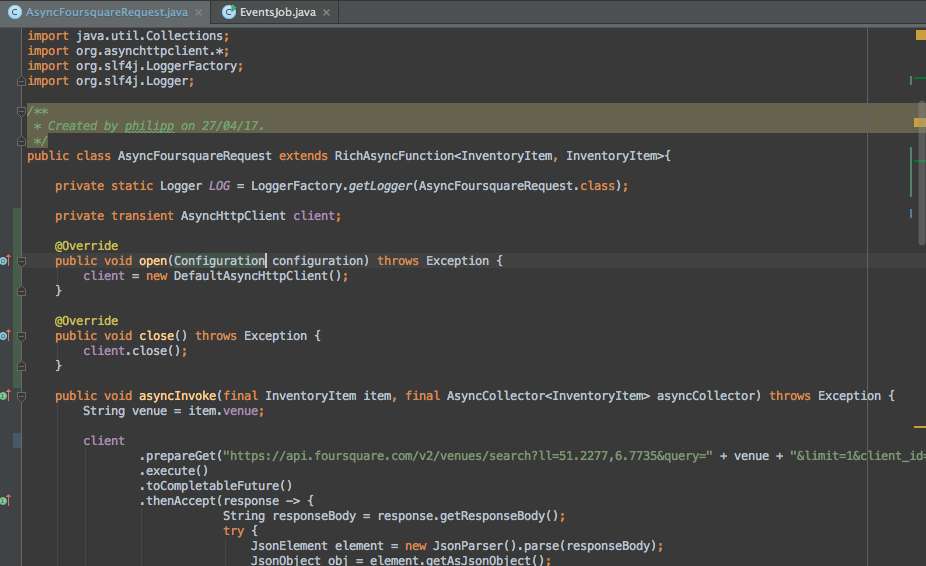
You might have already realised that my implementation lacks (or better stinks) when it comes to efficiency as it creates a new http client in each invocation of the „asyncInvoke“ method. Obviously in my initial implementation I forgot to add an open and close method that would take care of initialisation and disposal of a single http client that is used for all requests to the API. This should be causing the creation of all those io.netty.util.HashedWheelTimer objects which are filling up the heap. Changing the implementation was easy.
After a few days the positive results of the change were showing up in my monitoring dashboard. It was obvious that the memory consumption had changed a lot and was showing a natural behaviour now where memory was getting released again after a while.
I am happy to say that my memory leak is fixed now and I am delighted to see that the various monitoring tools which I have deployed were quite helpful in solving this riddle.